Obama Poll Watch [November 2009] -- Scraping Fifty Percent
November wasn't a particularly good month for President Obama in the polls. Not disastrous by any means, but not very cheerful either. Obama laid relatively low in the public eye last month, wanting to be seen (one assumes) as conferring seriously with his advisors over his new Afghanistan strategy. Which, unfortunately, translated into "not wanting to be seen" by the public.
But, by doing so, his approval numbers continued their gradual slide downwards this month. And, although not reflected in our once-a-month snapshot, the truly worrisome thing for the White House is that for the first time, Obama's numbers flirted with going below 50 percent. This isn't an enormous deal (as, for instance, going below 40 percent would be), but it is still a big red flag to politicians, because it means you don't have the job approval of over half of the public.
So we begin today by taking a look at all of this and what it means, followed by our continuing march backwards through previous presidents (to see how their numbers line up with Obama's). This month, we take a look at Jimmy Carter's term in office.
Updated charts of how Obama compares to G.W. Bush, Clinton, G.H.W. Bush, and Reagan are available (as always) at the ObamaPollWatch.com site.
OK, now that I've unabashedly plugged the website (as our editors demand we do at least twice in each of these columns), let's take a look at this month's chart.
[Click on graph to see larger-scale version.]
November 2009
November started off for Obama with the media obsessing over a non-milestone -- the one-year anniversary of his election. I shamelessly joined in this frenzy, I freely admit. Election Day 2009 wasn't a great one for Democrats, but neither was it the disaster portrayed by some. Republicans picked up two governorships, in Virginia and New Jersey; but Democrats held on to a House seat in California ,and won a House seat in New York where the last non-Republican they elected was a Whig. This race was interesting, due mostly to an intraparty cage match among Republicans (Sarah Palin included). A deadly rampage took place in Fort Hood, Texas, on a military base, which rightfully shocked America. The Attorney General announced that Khalid Sheikh Mohammed would be tried in U.S. Federal Court in New York City, mere blocks from where the World Trade Center's twin towers used to stand -- a decision which was controversial (to put it mildly).
On the lighter side of things, Sarah Palin began a book tour. And healthcare reform ground slowly onwards in the Senate, winning a key vote 60-39 to begin debate on an actual bill. This was good news, but this merely procedural vote didn't get Obama any sort of bump in the polls as a result. To top the month off, two reality show wannabes crashed Obama's first formal state dinner.
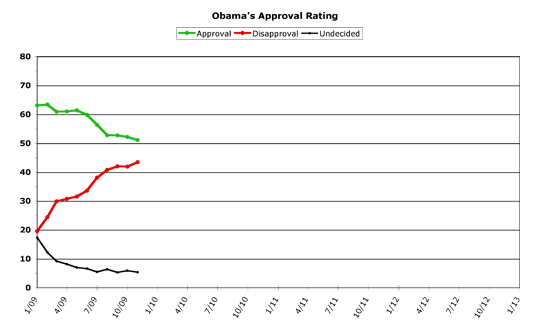
All of this added up to about a one-point drop for Obama in approval, and a slightly larger climb in disapproval over the course of November. Barack Obama's approval rate dropped 1.1 percent to a new all-time monthly low of 51.1 percent, averaged over the month. His disapproval went up 1.6 points, to 43.5 percent, a new all-time monthly high.
Overall Trends
Interestingly, Obama's daily approval numbers dropped their ceiling by a point as well, but his approval number ceiling barely moved. In both of the past two months, Obama charted a high in daily approval of 53.6 percent, but this month only managed to hit 52.6 percent, at mid-month. But his disapproval rate only went up from a daily high of 44.3 percent at the end of October, to 44.4 percent (a new all-time daily high) at the beginning of November, and then stayed below this mark all month long. But there was less variance throughout the month (only 2.3 percent difference between highest daily disapproval and lowest, versus 4.9 percent last month). Overall, Obama's approval rate improved in the middle of November, but then fell back at month's end. His disapproval rate was a mirror image of this.
But the big story in trendlines is the big five-oh. Obama posted approval numbers below 50 percent in four separate polls last month. Now, we all know Rasmussen's numbers are simply too unrealistic to pay much attention to, but Obama hit sub-50 numbers in Quinnipiac and Fox News as well. But the big shocker was he also hit the high 40s in a Gallup poll, which is one of the most trusted polls around.
Because we use numbers from the RealClearPolitics website, which comes up with a daily average (a "poll of polls") of the most recent polling, and then we further average all the monthly numbers into one data point for our charts; this is not visible in the above graph. Yet. But at the end of November, Barack Obama's daily average fell to the all-time low of 49.9 percent. Since then, it has risen slightly, but is still scraping the 50 percent line. This is causing the White House no small degree of concern. As it should.
Their answer seems to be to get Obama out there in front of the public again, and create a flurry of activity. President Obama kicked off the month with a formal announcement of his Afghanistan policy (more on this in a bit), followed immediately by a "jobs forum" (the White House is reportedly shying away from the term "summit" these days) later in this week, and has decided to go to Copenhagen for the international climate conference as well, after initially indicating he would skip it.
Beyond the White House's control, though, December also has other events lined up for Obama and the Democrats. Traditionally, since December is the end of the legislative year, a lot of bills may get passed by Congress before they recess for the end of the year. Most of these will be minor-to-middlin' on the grand scale of lawmaking, but they may offer a chance for a few signing ceremonies for Obama. This may help him on the "getting things done" front with the public. Unfortunately, healthcare reform is likely not going to be ready for Obama's signature before the end of the year. However, if Harry Reid can get a bill through a final vote in the Senate, this will be the best and biggest Christmas present the president could realistically get from Congress, considering the time left for them to act. And Obama will also travel (during the Copenhagen trip) to pick up his Nobel Peace Prize.
Any or all of this could have an effect on the polls for Obama. But it's a pretty mixed bag. The most obvious disconnect is announcing a huge buildup of troops in Afghanistan, and then picking up a peace prize in the same month. Other than that ironic coincidence, the Afghanistan decision could actually dominate any movement in the polls in December. But again, it's hard to say which direction this will take.
A significant proportion of Obama's base is not happy with his Afghanistan decision. Meaning his base support could erode even further than it already has. However, this time there is a counterweight -- because Republicans and conservatives (neo- and other) actually may support the president's new Afghanistan strategy. This could result in a drop in Obama's disapproval numbers over the month, although at this point most of them will likely move from "disapprove" to "undecided," at best. But who knows -- Obama may find some support in some very unlikely quarters soon, while at the same time losing support from some very familiar areas. This will be tough to analyze in the raw poll numbers, it should be noted. The next two weeks should show whether Obama's Afghanistan policy will either help him or hurt him politically.
Obama v. Jimmy Carter
We've worked our way back through the past four previous officeholders, as they stack up to Barack Obama's numbers, meaning it is now time to look at Jimmy Carter's single term as president.
Before we get to the charts, however, a quick review of a few of these is in order. Obama versus Clinton shows the two had roughly the same numbers at this point in their first terms, but Clinton's numbers were on the rise (after a drastic falloff in late spring). And, as we pointed out last month, Obama's numbers are still closely tracking the trends of Reagan's first term, who also faced severe economic pain at roughly the same time in his presidency. To see all the updated charts of past presidents versus Obama, check out the ObamaPollWatch page.
But let's move on to James Earl Carter, Jr., and how Jimmy stacked up to our current president.
[Click on graphs to see larger-scale versions.]
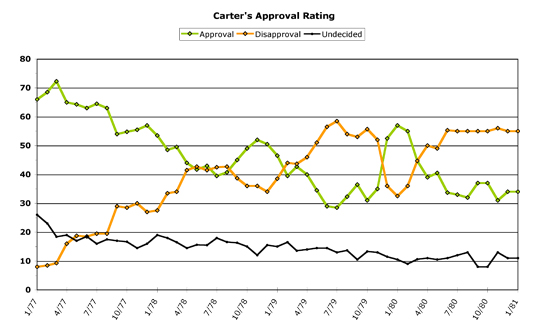
Carter's graph is pretty eclectic. The most interesting thing I noticed right away is the high percentage of Americans who apparently just couldn't make up their minds about Carter. Now, most presidents start off with a fairly high "undecided" line (the black line above) when they first enter office, but after the "honeymoon" period this usually settles down to single digits. Occasionally this will stay above ten percent, or spike up above ten percent, but for the most part people eventually make up their minds about any president, pro or con. Not so with Carter, who only posted three undecided numbers below ten percent during his entire term. Now, this was before the rise of rightwing talk radio (Rush Limbaugh, et al), and long before the rightwing media echo chamber (cough, cough, Fox News, cough) existed. Perhaps this has something to do with it, I'm not sure. But it does stand out when you look back at other presidential approval graphs, for whatever it's worth.
Carter entered office with sky-high approval ratings, and rode his "honeymoon" period longer than most presidents. But Carter faced rough economic times throughout his entire term, and his responses to the economy were not always very well-received. In late 1977, he signed the Panama Canal Treaty which would eventually hand over control of the Canal Zone back to Panama. This was loudly criticized at the time, and his first big drop in approval ratings can be tied directly to the treaty. Even so, his approval didn't drop below 50 percent until over a year of his term had passed.
His first big bump in the polls came at the end of 1978, when he brokered the Camp David Accords, the first peace agreement in the Middle East between Israel and an Islamic country, and one that still stands today. But by the end of 1979, his numbers had tanked to below 30 percent approval, a result of a combination of factors. The energy crisis (and gas prices and lines) hit Carter hard, and not even negotiating a strategic nuclear arms treaty (S.A.L.T. II) with the Soviet Union helped much. But right at the end of the year, two things happened which gave Carter a temporary "rally 'round the president" effect in the polls -- the Soviets' invasion of Afghanistan, and the Iranian revolution. Iran overthrew the Shah and took Americans hostage -- which would remain as a serious stalemate until Ronald Reagan's inauguration day. While Carter's approval soared to the high 50s, it soon came crashing back down to the low 30s as America was faced with a "number of days" clock each night on the evening news, showing how long it had been since the Americans had been taken hostage by the Iranians. These dismal poll numbers would continue for the last year of Carter's term.
But let's look at how Obama measures up to Carter's numbers, at least so far.
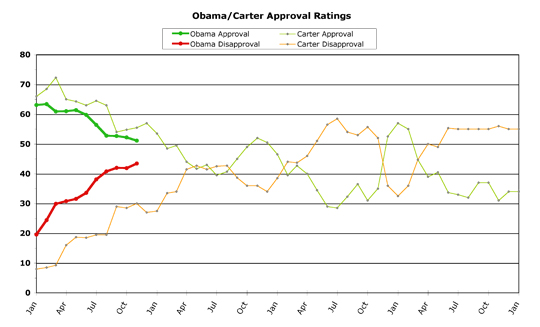
There are some similarities between Carter and Obama, most noteworthy in their "outsider" campaign to "change Washington." The difference is that Carter actively took on Congress (dominated by Democrats at that point), without much ultimate success. The Democrats in Congress at this point believed themselves more powerful than the White House, and had no compunction in showing it. Obama at least has a somewhat-chastened Democratic majority, elected back into power after wandering in the minority party wilderness for much of the past 15 years.
But a key lesson to be learned from Carter's eclectic graph is that nobody can predict with accuracy how a president's term will end. Carter faced so many different events during his term -- some good, but most bad -- that his graph resembles a rollercoaster. As with comparing Obama to Reagan's first term, the trendlines for the first year of Carter versus Obama look very similar in direction. But who can say at this point whether Obama will have a gradual swing back up (as Reagan did) or continuing ups and downs throughout his term in office (as Carter did).
The lesson of Carter's term in a nutshell -- sometimes external events overtake good intentions. Whether this lesson is applicable to Obama or not, only time will tell.
[Obama Poll Watch Data:]
Column Archives
[Oct 09], [Sep 09], [Aug 09], [Jul 09], [Jun 09], [May 09], [Apr 09], [Mar 09]
Obama's All-Time Statistics
Monthly
Highest Monthly Approval -- 2/09 -- 63.4%
Lowest Monthly Approval -- 11/09 -- 51.1%
Highest Monthly Disapproval -- 11/09 -- 43.5%
Lowest Monthly Disapproval -- 1/09 -- 19.6%
Daily
Highest Daily Approval -- 2/15/09 -- 65.5%
Lowest Daily Approval -- 11/25/09 -- 49.9%
Highest Daily Disapproval -- 11/4/09 -- 44.4%
Lowest Daily Disapproval -- 1/29/09 -- 19.3%
Obama's Raw Monthly Data
[All-time high in bold, all-time low underlined.]
Month -- (Approval / Disapproval / Undecided)
11/09 -- 51.1 / 43.5 / 5.4
10/09 -- 52.2 / 41.9 / 5.9
09/09 -- 52.7 / 42.0 / 5.3
08/09 -- 52.8 / 40.8 / 6.4
07/09 -- 56.4 / 38.1 / 5.5
06/09 -- 59.8 / 33.6 / 6.6
05/09 -- 61.4 / 31.6 / 7.0
04/09 -- 61.0 / 30.8 / 8.2
03/09 -- 60.9 / 29.9 / 9.2
02/09 -- 63.4 / 24.4 / 12.2
01/09 -- 63.1 / 19.6 / 17.3
Questions or comments? Use the Email Chris page to drop me a note.
Cross-posted at The Huffington Post
Follow Chris on Twitter: @ChrisWeigant
-- Chris Weigant


I don't think we're going to see that upwards bump in Obama's approval ratings ya'all were hoping for.
The downward slide is going to continue, fueled by Obama's own base.
Michale.....
Reaction in Afghanistan is "mixed:"
http://www1.voanews.com/english/news/Afghan-Reaction-Mixed-Toward-New-US-Strategy-78326622.html
and has decided to go to Copenhagen for the international climate conference as well, after initially indicating he would skip it.
Obama should remember what happened the LAST time he went to Copenhagen and just stay in bed...
:D
Michale.....