
Electoral Math -- One Month Out
Looking at the presidential polling for the past two weeks, I am reminded of a famous line from Western movies (that has now become a total cliché): "It's quiet out there... too quiet."
Normally, by now I would have started writing one of these columns every week, but I decided not to do so last week because... well... nothing much was really happening in the polls. This week is largely the same, but I'm going to start posting these weekly anyway since we're only four weeks away from Election Day.
Things have barely budged in the past two weeks. In these charts, the lines are almost completely flat. There have been a few (very few) minor wiggles, but for the most part the important trendlines haven't budged in either direction. If the polls turn out to be right, this could wind up being yet another extremely close presidential election, hinging on a few tens of thousands of votes in a few key states.
That's if the polling is correct, of course. Which it may not be. In the past two presidential elections, the pollsters have underestimated Donald Trump's support. What were supposed to be blowout elections for both Hillary Clinton and Joe Biden turned out instead to be nail-biters.
If the same thing happens this year, what is supposed to be a nail-biter could turn out to be an easy win for Trump. The margins are so close that if the polling is off by even two or three points in the crucial battleground states in his favor, then Trump could emerge victorious.
But the pollsters are keenly aware of what happened in the past two elections, and they've been diligently working to improve their forecasting models. This was made more difficult by the fact that the 2020 election was held in the middle of a once-in-a-century pandemic, so nobody knows what effect that truly had on voter turnout -- but it's likely it was not insignificant. So none of the pollsters really know if their new-and-improved methodologies really reflect the reality on the ground or not.
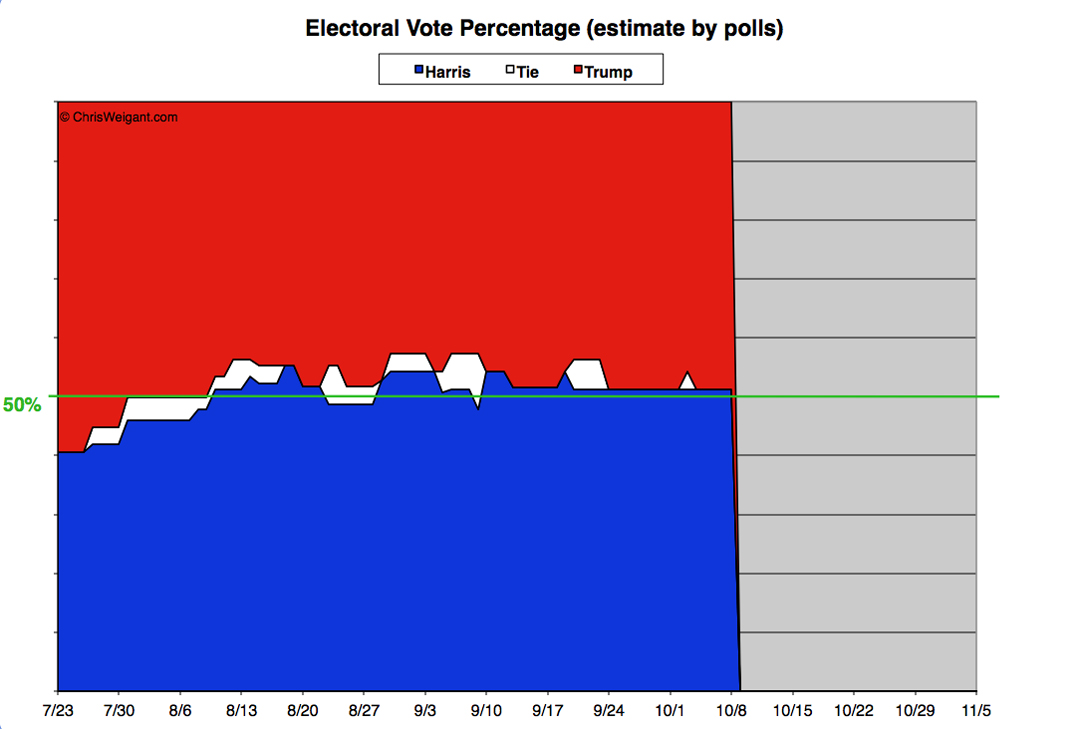
In any case, let's look at the state-by-state polling, with data (as always) provided by the fantastic Electoral-Vote.com site. The first of our charts shows the distribution of Electoral College votes based on the current state-level polling. Donald Trump's share of the Electoral Votes (EV) is in red and runs from the top of the graph downwards. Kamala Harris's share of EV is in blue and runs from the bottom up. States that are perfectly tied are shown in white. Whichever color crosses the 50-percent line in the middle will win the election (if all the polling is perfectly correct, of course).
[Click on any of theses graphs to see larger-scale versions.]
This is, you will note, rather static. Nothing much changed.
Two weeks ago was the point on this graph where the big white area disappeared, signifying no state was currently tied. From this point on, the line for Harris didn't budge at all, while one state (North Carolina) briefly moved into being tied before moving right back into Trump's column (that's the little pointy white triangle). In fact, only three other states even showed any polling movement at all in the past two weeks, and none of them affected this chart at all (no states actually flipped candidates, in other words).
Both candidates were remarkably consistent, as you can quite obviously see. Harris started the period with 276 EV and ended with exactly the same number. This is only 6 EV above the necessary magic number to win the Electoral College vote, which is way too close for comfort.
Trump barely budged as well, starting off the period with 262 EV, briefly (for one day) dropping down to 246 EV (with North Carolina being tied), but then bouncing right back up to the same 262 EV that he started with.
You can pretty easily see why I didn't bother to write a column last week! No comment was really necessary other than a quick: "Nothing's changed, check back later."
The percentages (of the Electoral College) didn't budge either. If the polls all prove to be right, Harris will win 51 percent of the Electoral College vote, while Trump will wind up with 49 percent -- which is about as close as things can be.
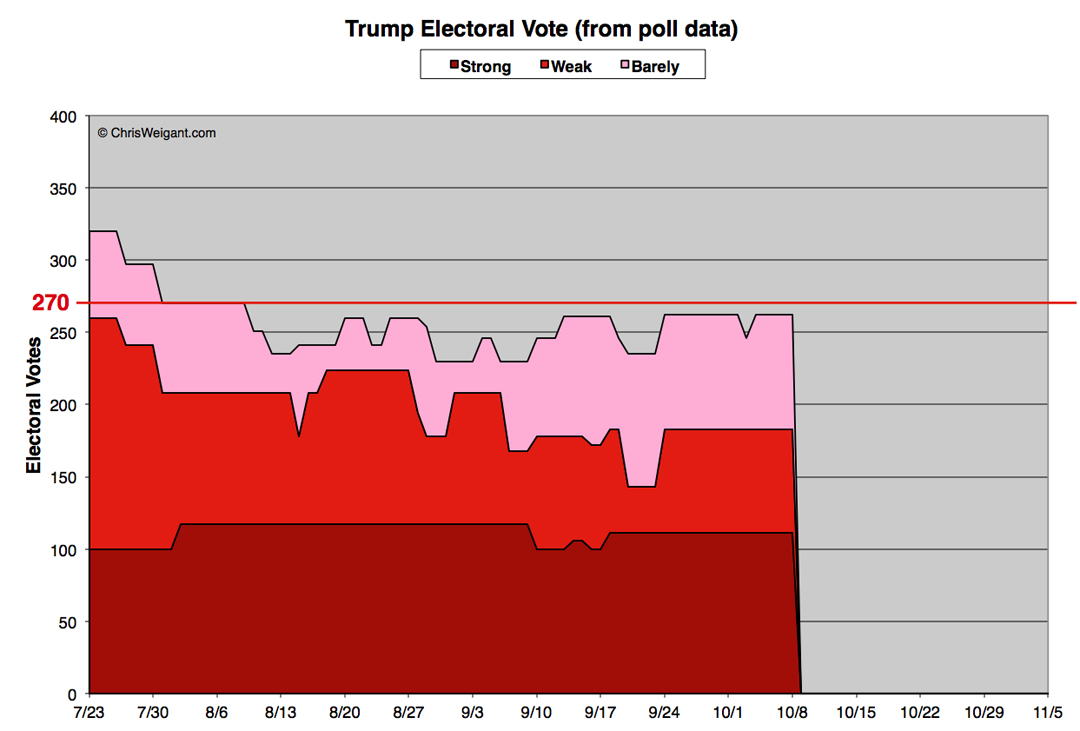
Let's move along to the individual charts showing relative strength in the state-level polling. Although I have to warn everyone: these are also almost as boring as that first chart. First up, let's see how Donald Trump has been doing.
As always, states are divided into three categories, depending on the state's polling margin. A lead of less than 5 points goes into the "Barely" column. A lead of 5 to 10 points means "Weak," and a lead of over 10 points is considered "Strong."
Pretty flat, huh?
Our last look at Trump's polling ended right when he gained Florida back in the Weak category (which ended that rather large dip downwards in the middle of the chart). Since then, nothing has changed at all in Trump's Strong or Weak numbers, and there was only that one-day dip in his Barely numbers as North Carolina wound up tied for a day before bouncing back for Trump.
Trump did get some good news, but it was more of a confirmation than anything new. Alaska posted a new poll that almost moved it to the Strong column, but fell just short. And South Carolina posted their first poll since April, and it showed exactly what you'd expect, a very Strong lead for Trump. Several new polls were posted for Texas which showed Trump with a surprisingly small margin, but it was still enough to keep the state in the Weak category for now.
Trump's overall number only fluctuated for one day when North Carolina was tied. Otherwise he stayed at 262 EV total, which is 8 EV short of the goal. Everything else stayed exactly the same for the entire two weeks for Trump. He started and finished with 111 EV in the Strong category and 72 EV in Weak. His Barely number slipped from 79 EV down to 63 EV before recovering the next day.
Trump's "Strong plus Weak" total didn't budge an inch, staying at 183 EV for the whole period. All of his numbers were about as flat as they could be, really.
Kamala Harris didn't have much movement either, although marginally more than Trump did:
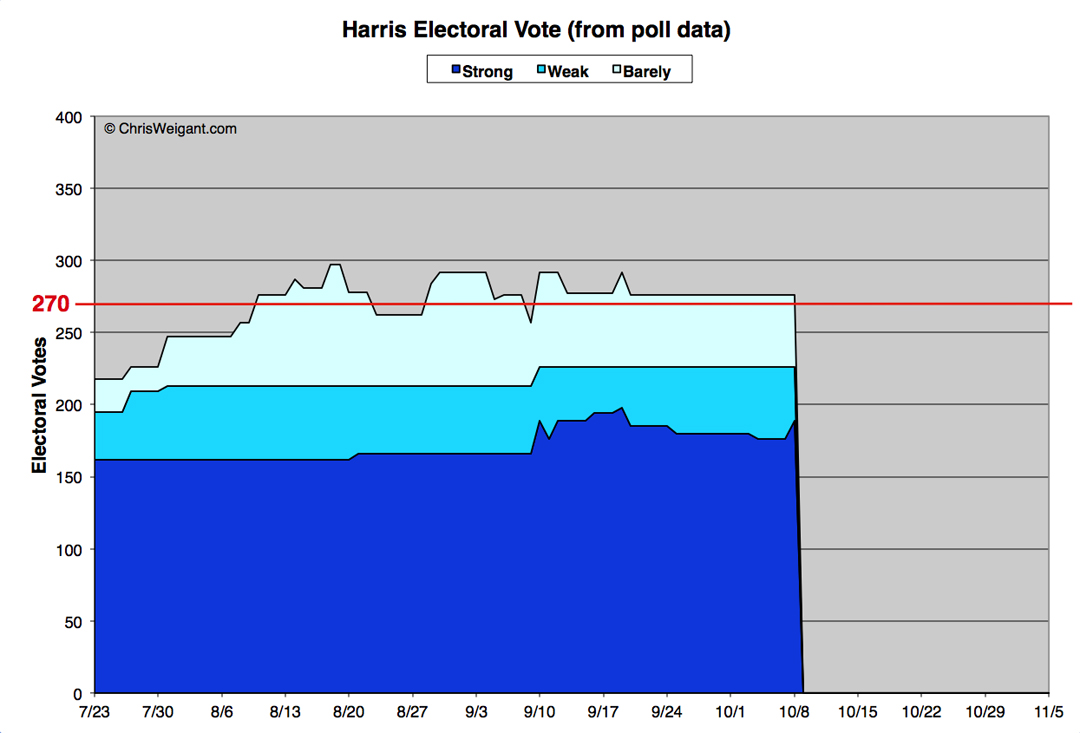
That's not quite as flat as Trump's chart, but not by a whole lot.
All the movement for Harris in the past two weeks has been between Strong and Weak. The period started off with Harris at 185 EV in her Strong column, but the first day she lost 5 EV when New Mexico moved from Strong to Weak. A little more than a week later, New Hampshire also moved from Strong to Weak, leaving Harris with only 176 EV in her Strong column. However, today a poll posted from Virginia which moved it up from Weak to Strong, which gained back both losses and then some. Harris ended the period with 189 EV in her Strong column. As with Trump, Harris did get one new poll confirming what everyone already knew, that Delaware was Strong for Harris (the state hadn't been polled since April, but then again it is the home state of Joe Biden).
Harris's Weak numbers mirrored the changes in her Strong numbers exactly. She started the period with 41 EV in Weak, moved up to 46 EV and then 50 EV as New Mexico and New Hampshire shifted, and then dropped back down to 37 EV as Virginia improved. The numbers in the Barely column for Harris didn't budge at all, staying at 50 EV for the whole period.
Due to this mirroring, Harris's Strong plus Weak number didn't move either, staying at 226 EV for the entire period. Overall, her graph stayed about as stable as I've seen any of these graphs manage for a two-week period.
My Picks
Which brings us to the "gut feelings" part of the program. I did get confirmation for two states I had put solidly in each candidate's "Likely" column: Delaware for Harris, and South Carolina for Trump. Both states finally released polls that had Harris on the ticket (instead of Biden) and they both confirmed what were admittedly two pretty easy guesses.
Just to make things a little more interesting (in a very boring two weeks), I have made some slightly-bold movements for some marginal states.
Also as usual, all of these picks are divided into "Safe," "Probable," and "Leaning" for each candidate, with a final "Too Close To Call" category at the end.
Likely States -- Harris
Safe Harris (20 states, 226 EV)
I am reversing the movement I made last time around for both Maine and Virginia, and moving them back up to Safe (from Probable) for Harris. Maine hasn't had any new polling, but it seems like a sure bet for Harris, at least to me. Virginia did just post one very good poll for Harris, but she's been pretty comfortably ahead in all the other polling as well, so I feel pretty confident about the state going for Harris in the end.
Probable Harris (1 state, 15 EV)
Both Maine and Virginia moved out of this column (both upwards for Harris), and I am being optimistic and including Michigan here to replace them. This may prove to be too optimistic -- I can easily see having to move it downwards again -- but for now it seems Harris has a consistent lead of anywhere from a few points up to roughly five points. She has even broken the 50-percent mark in a few polls, which is usually a signal of strength for any candidate. Again, I may have to revisit this later, but for now I am feeling upbeat about Michigan for Harris.
Likely States -- Trump
Safe Trump (20 states, 126 EV)
The only change here is the addition of Alaska, up to Safe Trump from Probable Trump. Alaska never really seemed in doubt, and the latest poll showed Trump with almost a double-digit lead, so the state obviously belongs in the Safe category for him.
Probable Trump (4 states, 93 EV)
As just mentioned, Alaska moved up to Safe this week. I also considered moving Ohio up to Safe as well, since with JD Vance on the ticket it seems like a pretty sure bet, but the polling hasn't been overwhelmingly for Trump here of late, so I am going to keep it as just Probable Trump for now. The big news, however, is that I moved Florida up from just Lean Trump to Probable, based on the fact that he's been pretty consistently ahead in the state and one recent poll put him up by 13 points. So it's hard to see the state as merely a Lean Trump state, at this point. The two other states in this category, Iowa and Texas, both stayed the same, with good (but not overwhelming) numbers for Trump.
Tossup States
Lean Harris (2 states, 16 EV)
Michigan firmed up enough for me to move it up to Probable Harris, but Wisconsin is still uncomfortably close (even though Harris has had a consistent small lead). Wisconsin's polling proved to be wildly inaccurate (by underestimating Trump's strength) in both 2016 and 2020, which also may be a factor. But in a burst of optimism I decided to move Nevada up to Lean from Too Close To Call. The polling doesn't really justify this move, as it has been pretty neck-and-neck, but the latest poll showed a bigger lead for Harris so I am perhaps recklessly moving it up to Lean Harris for now.
Lean Trump (2 states, 27 EV)
As already mentioned, Florida made the big leap up to Probable Trump this time around, but I decided to keep Georgia as just Lean Trump for now. Polling in Georgia has been odd, showing either an incredibly tight race or Trump leading by roughly five points. This could be bias in one particular pollster, showing up with every poll they release, perhaps. If Trump does ever start polling consistently higher (with no neck-and-neck polls at all) then I'll considering moving Georgia up for Trump, but for now it stays where it is. But the big news here for Trump is that I have moved Arizona up from Too Close To Call. Much like me moving Nevada up for Harris, this may prove to be unfounded. The polling has been neck-and-neck for the most part, but Trump just posted a pretty good poll here and has been consistently leading by at least a point in most polls. So for now (but perhaps not for long) I'm moving the state up to Lean Trump.
Too Close To Call (2 states, 35 EV)
All this enthusiasm for moving states around has left only two states as Too Close To Call: North Carolina and Pennsylvania. Over the past week or so, Trump seems to have a miniscule edge in North Carolina while Harris seems to have a very small edge in Pennsylvania, but they're both so close it's impossible to say either state is leaning towards either candidate.
Final Tally
One thing worth mentioning before I wind things up for today is that both polling and the election itself may be impacted in a number of states by the devastation from Hurricane Helene. The storm hit parts of Georgia and North Carolina very hard, and it is impossible to say right now what this will mean in a month, but it's a good bet that some folks are so busy with their own lives right now that they're not going to answer the phone if a pollster calls. Hurricane Milton may also have an impact in Florida, which also suffered some Helene damage.
Storm impacts aside, as you can see the race for the White House is both incredibly close and incredibly static. Not much is changing at all, even though numerous polls are being posted in the battleground states. Neither candidate has a decisive edge, and the race could easily go either way.
I will be posting these columns weekly from now on, even if (as was the case today) there is not much movement to talk about.
In my gut-call groupings, the numbers did change a bit, but this may have been due to me just tinkering with where states were out of sheer boredom (I do admit the possibility).
Both candidates improved in their Safe and Probable totals this time around. Harris added one state (for a total of 21) to improve her standing from 226 EV to 241 EV. Trump improved his standing in Safe and Probable by one state as well (for a total of 24), but it was a doozy (Florida) so his overall number went up from 189 EV to 219 EV.
Harris now has two states in her Lean column, for a total of 16 EV. When you add this to her Safe and Probable states, she winds up with 257 EV -- 13 EV short of the goal. Trump also has two states in his Lean category, for a total of 27 EV. This boosts his overall total to 246 EV -- 24 EV short of the goal.
There's only so many different ways to say it -- this is going to be an extremely close election, if the polling is anywhere near accurate. With only four weeks to go, neither candidate is showing much of any progress in solidifying their position or flipping states from the other. The result is completely up in the air, and likely will remain that way right up until the votes are counted.
[Full Data:]
(State electoral votes are in parenthesis following each state's name -- and please note a lot of these have changed since 2020, due to the reallocation of House seats after the Census. Washington D.C. is counted as a state, for a total of 51.)
Kamala Harris Likely Easy Wins -- 21 States -- 241 Electoral Votes:
Safe States -- 20 States -- 226 Electoral Votes
California (54), Colorado (10), Connecticut (7), Delaware (3), Hawai'i (4), Illinois (19), Maine (4), Maryland (10), Massachusetts (11), Minnesota (10), New Hampshire (4), New Jersey (14), New Mexico (5), New York (28), Oregon (8), Rhode Island (4), Vermont (3), Virginia (13), Washington D.C. (3), Washington (12)
Probable States -- 1 State -- 15 Electoral Votes
Michigan (15)
Donald Trump Likely Easy Wins -- 24 States -- 219 Electoral Votes:
Safe States -- 20 States -- 126 Electoral Votes
Alabama (9), Alaska (3), Arkansas (6), Idaho (4), Indiana (11), Kansas (6), Kentucky (8), Louisiana (8), Mississippi (6), Missouri (10), Montana (4), Nebraska (5), North Dakota (3), Oklahoma (7), South Carolina (9), South Dakota (3), Tennessee (11), Utah (6), West Virginia (4), Wyoming (3)
Probable States -- 4 States -- 93 Electoral Votes
Florida (30), Iowa (6), Ohio (17), Texas (40)
Tossup States -- 6 States -- 78 Electoral Votes:
Tossup States Leaning Harris -- 2 States -- 16 Electoral Votes
Nevada (6), Wisconsin (10)
Tossup States Leaning Trump -- 2 States -- 27 Electoral Votes
Arizona (11), Georgia (16)
Too Close To Call -- 2 States -- 35 Electoral Votes
North Carolina (16), Pennsylvania (19)
Polling data gaps:
[Note: during the primaries, Zogby conducted a poll in every state on April 21, with the sole exception of Washington D.C., which has had no polling at all this cycle. But I thought it'd be more useful to keep track here of which states have not been polled since Joe Biden dropped out of the race.]
New polling data -- 3 States
(States polled with Harris for the first time since our previous column, with the dates of the new poll in parenthesis.)
Alaska (9/28), Delaware (9/19), South Carolina (9/29)
No polling data with Harris -- 13 States
(States which have not been polled since July 21st, with the dates of their last poll in parenthesis.)
Alabama (4/21), Hawai'i (4/21), Idaho (4/21), Kansas (4/21), Kentucky (4/21), Louisiana (4/26), Mississippi (4/21), New Jersey (4/21), North Dakota (4/21), Oregon (4/21), South Dakota (5/13), Washington D.C. (--), Wyoming (4/21)
-- Chris Weigant
Follow Chris on Twitter: @ChrisWeigant


Storm impacts aside, as you can see the race for the White House is both incredibly close and incredibly static.
I guess that shouldn't be much of a surprise, storm impacts aside, because both Harris and Trump want to out-do each other in terms of who can be best at expanding fossil fuel development.
It really would be laughable if so many lives weren't being lost or destroyed because of it - in the US and, indeed, across the planet.
And, if that wasn't bad enough, disaster relief agencies in the US are running out of money in the wake of Hurricane Helene and the impending ruinous Hurricane Milton. Congress members, however, have no plans to return to Washington before the election in order to approve more funding.
Again, laughable if it weren't so damaging to peoples' lives.
https://www.politico.com/news/2024/10/07/hurricanes-eroding-washingtons-disaster-programs-00182784
If the polls all prove to be right, Harris will win 51 percent of the Electoral College vote, while Trump will wind up with 49 percent -- which is about as close as things can be.
Trump will win 49% of the popular vote? In the United States? 49%?
I'll believe that when I see it.
Okay, you have to admit you've had one too many alcoholic beverages when you literally quote a sentence regarding the Electoral College vote and then question the veracity when it clearly states "Electoral College vote."
So... I've had one too many alcoholic beverages.
Heh.
Maine hasn't had any new polling, but it seems like a sure bet for Harris, at least to me.
Remember that Maine awards its 4 ECVs via the congressional district method. Although Harris is likely to win District 1 and 3 and thus the State of Maine (3) total ECVs, Trump is likely to win (1) from District 2.
Remember that for Nebraska's 5 ECVs, Harris is likely to win District 2 (1) with Trump winning the other 3 districts and thus the State of Nebraska and (4) total ECVs.
People like to claim that these "zero each other out," but they really don't do that since they represent voters that are definitely counted.
only one? You're clearly not trying hard enough.
nypoet22
6
In my defense, I did lose count.
I'll try harder next time. :)