Electoral Math -- Tight Race Gets Even Tighter
Last week, we called the presidential race "as close as things can get." This week we have to up that to "even closer than close," we suppose. As things stand, there are two states perfectly tied in the polls, which leaves neither candidate with enough to win the Electoral College outright without adding at least one of them.
At this point, it's hard to say if anything that is happening in the polls is truly all that meaningful. All of the changes that have been happening have been states wobbling around on razors' edges, between favoring one candidate by a point or two to being perfectly tied to favoring the other by a point or two. All seven of the battleground states are essentially doing this, so the shifts are really just the margin of error between the different pollsters, for the most part. Neither candidate has managed to secure a definitive edge in any of them. No clear trends have appeared anywhere.
With two weeks to go before Election Day, it's anyone's guess what is going to happen. Things could go either way. Either Donald Trump or Kamala Harris could sweep all (or almost all) of the battleground states, or they could divvy them up between them. The result in the Electoral College might wind up being one of the closest elections in American history, or one candidate could wind up with over 300 votes. It's really anyone's guess.
Let's take a look at this week's charts, although I will admit that they really don't tell us much, other than "it's really close."
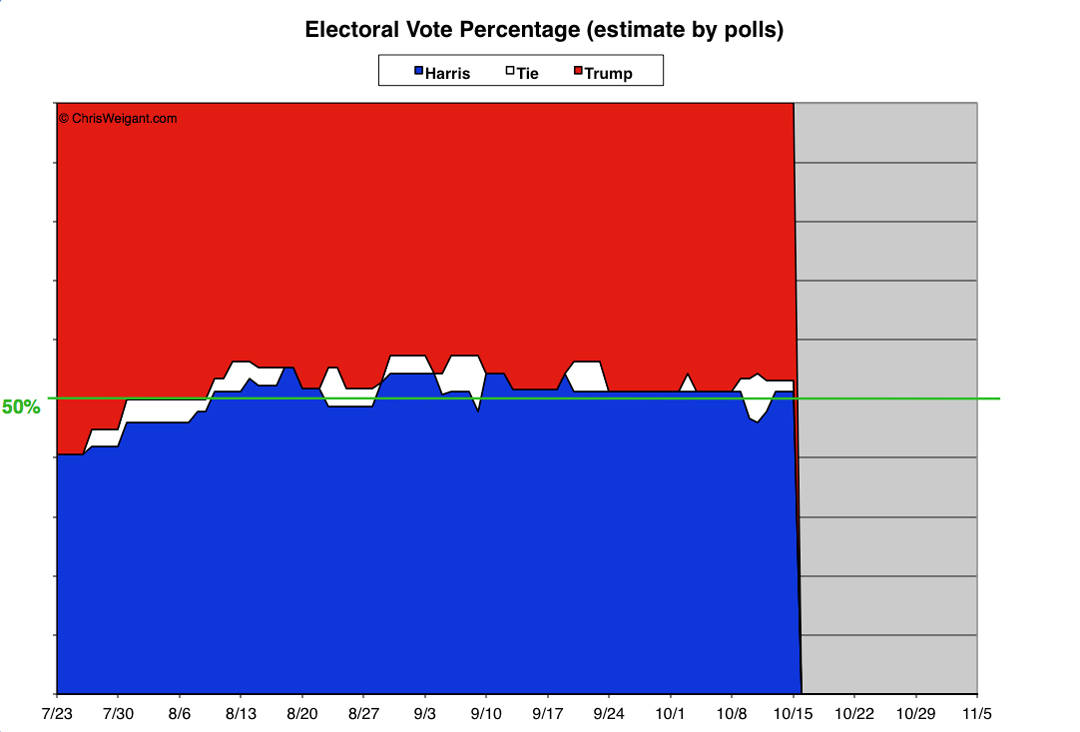
The first chart shows the state-by-state polling added up for both candidates. As always, data is provided by the Electoral-Vote.com site, which tracks current polling in every state. Each state's Electoral College votes are added into the totals for both candidates, to see who has enough states to win.
Donald Trump is represented in red, from the top of the chart downwards. Kamala Harris is in blue, from the bottom up. Whichever color crosses the center 50-percent line should (if all the polling is perfectly accurate) emerge as the winner. But as mentioned, the white areas show states that are Tied, and (just like last week) this week that's where the action was.
[Click on any of theses graphs to see larger-scale versions.]